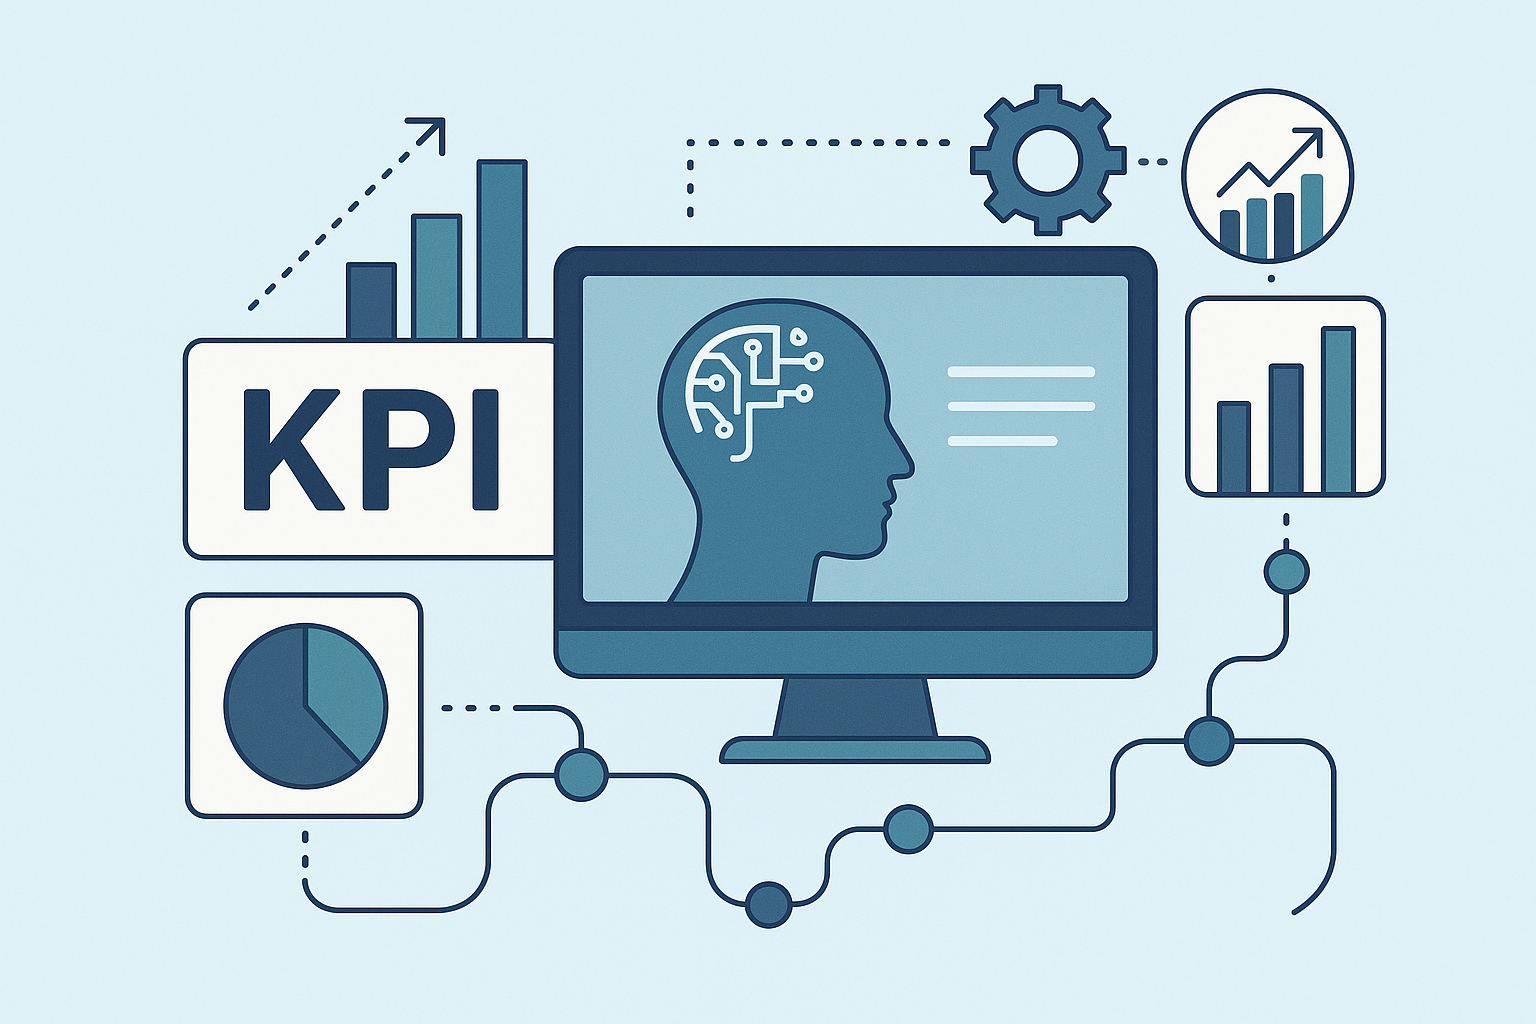
KPI-driven artificial intelligence workforce implementation roadmap
Organizations adopting AI to augment or partially replace human work face three common failures: unclear objectives, weak measurement, and poor governance. This tactical guide lays out a practical, KPI-driven artificial intelligence workforce implementation roadmap designed for business leaders, product and operations managers, HR/workforce planners, AI/ML leads, and CTOs. you'll get a concrete step-by-step plan, a detailed KPI taxonomy and instrumentation guidance, best-practice checklists, three real-world case studies, and a 2026 tools & trends primer to operationalize and measure AI-driven workforce outcomes.
Executive summary and objectives
Purpose: Use KPIs to align AI workforce initiatives to business outcomes-revenue growth, cost optimization, throughput improvement, and risk reduction-while preserving ethical and compliance requirements. A KPI-driven approach turns an experimental AI project into a reliable, measurable capability.
Expected outcomes from following this KPI-driven artificial intelligence workforce implementation roadmap:
- Clear alignment: KPIs that map to revenue, cost, service levels, and employee experience.
- Measurable pilots: Rapid validation with baselines and SLOs to de-risk scaling.
- Operational stability: Continuous monitoring of models, data, and human-AI collaboration.
- Governed growth: Audit trails, compliance metrics, and change controls for enterprise scale.
Step-by-step KPI-driven roadmap
The roadmap below defines phases you can follow to deploy a measurable AI workforce. Each phase includes deliverables, owners, and typical timelines.
Phase 1 - Assess & Benchmark (2-6 weeks)
- Deliverables: Process inventory, value hypothesis, stakeholder map, baseline metrics dashboard.
- Activities: Map tasks suitable for AI augmentation, quantify current throughput, cycle time, error rates, cost per transaction, employee effort hours.
- Owners: Product/operations lead, data science, HR.
Phase 2 - Design KPIs & Governance (2-4 weeks)
- Deliverables: KPI taxonomy, SLOs, reporting cadence, data access policy, risk register.
- Activities: Choose outcome KPIs and observability KPIs (model accuracy, latency, drift), define thresholds and alerting rules.
- Owners: PM/ops, ML engineering, legal/compliance.
Phase 3 - Pilot & Validate (6-12 weeks)
- Deliverables: Pilot model or automation flow, instrumentation for metrics collection, A/B or canary test plan.
- Activities: Run controlled experiments, collect baseline vs. pilot KPIs, validate human-in-the-loop workflows and UX.
- Owners: Data scientists, engineering, frontline managers.
Phase 4 - Scale & Operationalize (3-9 months)
- Deliverables: Production-grade model deployment, integrated monitoring, SLA contracts, training programs.
- Activities: Expand to multiple teams/geographies, ensure data pipelines and model CI/CD are mature, set up role-based access control.
- Owners: Engineering, IT, HR, security.
Phase 5 - Monitor & improve (Ongoing)
- Deliverables: Continuous dashboards, automated retraining pipelines, incident postmortems, ROI tracking.
- Activities: Track drift, measure productivity delta, update KPIs as business evolves.
- Owners: ML Ops, SRE, product analytics.
Phase 6 - Continuous Governance & Improvement (Ongoing)
- Deliverables: Audit logs, periodic compliance reports, governance board reviews, employee reskilling plans.
- Activities: Quarterly reviews of KPIs, risk reassessment, scorecard updates.
- Owners: Governance council (legal, ops, HR, ML leadership).
Best-practices checklist and concrete recommendations
Use this checklist during roadmap execution to reduce risk and accelerate value capture.
- Governance: Create a cross-functional governance council; require KPI sign-off before pilot start.
- Change management: Communicate purpose, share baseline KPIs and projected impact, run joint workshops with affected teams.
- Data readiness: Validate schemas, completeness, and lineage. Implement data contracts and golden datasets.
- Model lifecycle: Implement CI/CD for models, versioning, canary deployments, and rollback plans.
- Workforce augmentation: Design human-in-the-loop stages-assist, audit, and override-and define acceptance criteria.
- Risk mitigation: Define fail-safe behavior, incident runbooks, and impact thresholds (e.g., suspend automation if error rate > X).
- Observability: Monitor both technical metrics and business KPIs in one pane; instrument event-level logs for root cause analysis.
- Ethics & compliance: Include fairness, explainability, and data retention KPIs in governance scorecards.
Detailed KPI taxonomy and measurement methods
A solid KPI taxonomy lets you correlate model health with business outcomes and human performance. Below are recommended categories, example KPIs, instrumentation guidance, baseline/target guidance, SLO setup, and reporting cadence.
1. Business outcome KPIs
- Revenue impact: incremental revenue per month attributable to AI (calculate via A/B tests or holdout groups).
- Cost savings: labor cost reduction and operational expense delta (use time-sheets and throughput metrics).
- Throughput: transactions processed per hour/day (compare pre/post rollout).
- How to instrument: tie event logs to revenue tags and user IDs; use experiment IDs for A/B attribution.
- Baseline & targets: baseline = historical mean; target = baseline + expected uplift (e.g., +10% throughput in quarter 1).
- SLOs: e.g., maintain >= 95% of target throughput with <5% regression events monthly.
2. Operational metrics
- Productivity: tasks per FTE, time saved per task.
- Cycle time: average time from request to completion.
- Error rate/quality: percentage of items requiring rework.
- Instrumentation: time-stamped workflow logs, time-on-task measurement tools, quality audits.
- Reporting cadence: weekly for operations, monthly for leadership.
3. Model metrics
- Accuracy/precision/recall or task-specific KPIs (e.g., NER F1 score).
- Latency: 95th and 99th percentile response times.
- Throughput: requests per second.
- Drift: feature distribution drift, label drift, and concept drift rates.
- Instrumentation: telemetry via model logs, feature-store sampling, drift detectors (e.g., KL divergence, PSI).
- SLOs: model accuracy >= X, latency P95 < Y ms, drift alert if divergence > threshold.
4. Data quality KPIs
- Completeness: % non-null fields.
- Freshness: lag between event and ingestion.
- Accuracy: label error rate from audits.
- Instrumentation: data validation checks, schemas, and lineage systems (pre-ingest validators).
5. Human-AI collaboration metrics
- Acceptance rate: % of AI suggestions accepted by humans.
- Override rate and reason codes.
- Time-to-decision: change in decision latency when AI assists.
- Employee satisfaction: survey scores and qualitative feedback.
- Instrumentation: UI event tracking, UX telemetry, and post-action surveys.
6. Ethical & compliance indicators
- Fairness metrics: demographic parity, disparate impact indices.
- Explainability coverage: % of decisions with explanations stored.
- Compliance audits passed/failed.
- Instrumentation: policy engine logs, audit trails, and model cards.
Measurement methods:
- Set baselines using at least 4-8 weeks of historical data when possible.
- Define primary and secondary KPIs-primary maps to business outcomes, secondary tracks operational health.
- Prefer controlled experiments (A/B, stepped-wedge) for causal attribution.
- Use SLOs (service-level objectives) with clear alerting thresholds and escalation steps.
- Establish reporting cadence: daily for critical model metrics, weekly for ops, monthly/quarterly for leadership reviews.
Case studies: measuring success post-implementation
These three publicly documented examples illustrate how enterprises instrumented and tracked AI-driven workforce changes using KPI-driven approaches.
Case study 1 - Google DeepMind: data center cooling (context & results)
Context: Google partnered with DeepMind to control data center cooling using reinforcement learning and operational telemetry.
- Chosen KPIs: energy consumption for cooling (kWh), overall PUE (power usage effectiveness), failure/incidents.
- Instrumentation: sensor telemetry, BMS integration, time-series databases, and model control logs.
- Baseline vs post-implementation: publicly reported results showed up to ~40% reduction in cooling energy and a roughly 15% improvement in overall energy efficiency in initial deployments.
- Lessons learned: tight integration to operations, rigorous safety constraints, and phased rollout were critical to maintain service continuity.
- Sample dashboard: PUE trend chart, cooling kWh by cluster, model action log with safety overrides, incident heatmap.
Case study 2 - JPMorgan Chase: COiN contract review automation
Context: JPMorgan built COiN (Contract Intelligence) to extract clauses and automate review tasks traditionally done by lawyers and operations teams.
- Chosen KPIs: documents processed per hour, error rate of clause extraction, manual review time saved, compliance exceptions.
- Instrumentation: document pipelines, extraction confidence scores, human override logs, and audit trails.
- Baseline vs post-implementation: publicly reported results indicated that COiN scaled contract review from hours to seconds for many documents and substantially reduced manual review hours (widely reported metrics measured in hundreds of thousands of labor hours saved annually).
- Lessons learned: maintain high-confidence thresholds, route low-confidence cases for human review, and instrument justification fields to support audits.
- Sample dashboard: documents/hour, confidence distribution, override reasons, and monthly labor-hours saved trend.
Case study 3 - GitHub Copilot: developer productivity augmentation
Context: GitHub Copilot (an AI pair programmer) was evaluated to measure productivity and developer experience improvements.
- Chosen KPIs: task completion time, keystroke reduction, accepted suggestions, developer satisfaction scores.
- Instrumentation: IDE telemetry (with consent), suggestion accept/reject logs, controlled experiment cohorts.
- Baseline vs post-implementation: internal evaluations reported significant reductions in task completion time and keystroke volume (e.g., developers completing tasks faster and accepting a meaningful share of suggestions in trials).
- Lessons learned: privacy-safe telemetry, opt-in cohort studies, and metrics tied to concrete developer tasks improve attribution.
- Sample dashboard: median task time by language, suggestion accept rate, top override reasons, and satisfaction trend.
Latest 2026 trends and tools
By 2026 the AI workforce ecosystem emphasizes observability, orchestration for LLMs, and integrated human-in-the-loop platforms. Adopt toolchains that support continuous evaluation, explainability, and enterprise governance.
Observability & monitoring
- Trend: Unified observability for model, data, and business metrics with anomaly detection and causal tracing.
- Tools: Modern stacks include time-series platforms (Grafana, Datadog), model-focused observability (Arize AI, WhyLabs, Fiddler), and integrated traces.
- Recommendation: Instrument event-level logs and business KPIs in the same monitoring system to correlate incidents quickly.
MLOps & ModelOps platforms
- Trend: Full lifecycle automation-training, validation, CI/CD, deployment, and governance pipelines.
- Tools: Weights & Biases, MLflow, Tecton, Kubeflow, Domino (examples of mature platforms).
- Recommendation: Select platforms with built-in lineage, versioning, and approved integration points for governance tooling.
LLM orchestration
- Trend: Orchestration frameworks for chain-of-thought, retrieval-augmented generation (RAG), and safeguarded prompts.
- Tools: LangChain and RAG orchestration libraries have matured; look for enterprise-grade privacy features and guardrails.
- Recommendation: Use orchestration that supports telemetry, prompt versioning, and can be tested in canaries before production rollout.
Workforce augmentation platforms
- Trend: Platforms that combine human workflows with AI suggestions, task routing, and reskilling dashboards.
- Tools: Emerging specialist vendors plus integrated modules in major workflow systems; prefer platforms that capture accept/override signals.
- Recommendation: Choose platforms that expose standardized event streams for KPI instrumentation.
Analytics & ROI tools
- Trend: Attribution analytics that tie AI actions to business outcomes using experiment IDs and causal inference.
- Tools: Business intelligence (Looker, Tableau), experiment analysis libraries, and ROI calculators.
- Recommendation: Create a single source of truth for ROI metrics and automate monthly ROI reports to the governance council.
Templates, sample KPI dashboard wireframes, governance checklist, and next steps/playbook
The following artifacts summarize what to operationalize immediately.
Template: KPI dashboard wireframe (components)
- Header: Project name, owner, latest status, last update.
- Top KPIs: Business outcome KPI tiles (revenue delta, cost saved, throughput change).
- Model Health: Accuracy, latency (P95/P99), drift scores, version in production.
- Operational Health: Tasks/hour, cycle time, error rate.
- Human-AI Metrics: Acceptance rate, override reasons, employee satisfaction.
- Incidents & Alerts: Recent incidents, root causes, status.
- Audit & Compliance: Last audit date, policy exceptions, privacy flags.
Governance checklist (quick)
- KPI taxonomy approved and linked to business owner.
- Baseline data captured and validated.
- SLOs and alerting thresholds defined.
- Data contracts and lineage in place.
- Human-in-the-loop procedures documented.
- Audit trails and model cards published.
- Reskilling plan for impacted roles.
Next steps / playbook for practitioners
- Run a 4-8 week assessment to establish baselines and quick wins.
- Define 3 primary KPIs mapped to business value and 5 observability KPIs for monitoring.
- Execute a time-boxed pilot with instrumentation for all listed KPIs.
- Review results with the governance council; iterate on SLOs and escalation paths.
- Scale progressively with strong CI/CD, retraining policies, and workforce change programs.
- Institutionalize continuous measurement-report KPI health monthly and run quarterly recalibration of targets.
A KPI-driven artificial intelligence workforce implementation roadmap converts AI experiments into measurable, governed, and repeatable capabilities. Focus on aligning KPIs to clear business outcomes, instrument comprehensively across data-model-human layers, and choose toolchains that prioritize observability and governance. With the templates and checklist above, teams can reduce risk, demonstrate value, and scale responsibly.